- Home
- >
- Preservation Archaeology Blog
- >
- Mapping the Past
 |
By Katherine A. Dungan, Research Assistant
|

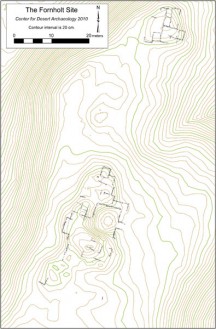
In our posts during the field season, we mentioned various aspects of Fornholt’s site layout—that it has northern and southern room blocks, two-story sections, a large depression in the southern room block—but we never posted a map of the site. I haven’t added our 2011 excavations to the master site map yet, but I want to share our 2010 working site map. I also want to explain how it was created and how it helps us understand the site.
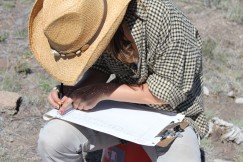
In summer 2010, we spent two weeks in Mule Creek with a crew of volunteers drawing rock-by-rock maps of wall segments at the Fornholt site. The wall segments you see on the map are those that were visible on the site surface, or that could be exposed by removing a few centimeters of vegetation and sediment. Our end goal was to create a detailed map while minimizing our impact on the site.
Back in Tucson, the individual wall segment maps were scanned and combined into a single map. The topographic contours were generated from thousands of super-accurate GPS (global positioning system) points. The resulting map, although it certainly doesn’t show every wall at the site, gives us a clear idea of the site layout.

The topographic contours show very clearly the height of the two-story portion of the southern room block and the general boundaries of the two room blocks. The topography also shows two intriguing depressions: a great kiva/plaza in the middle of the southern room block and another large depression between the two room blocks. This second depression may be an earlier Pithouse period great kiva or oversized pit structure. Alternatively, this feature might be associated with the same thirteenth- and fourteenth-century Tularosa Phase occupation as the room blocks. We may test this depression during next year’s field work.

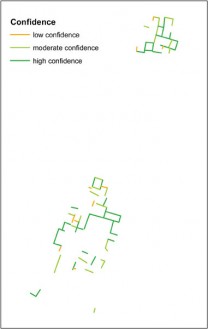
In drawing the 2010 maps, we recorded generalized rock type for all of the stones in each wall and recorded a few other attributes for each wall segment, such as confidence (“how certain are you that this is really a wall?”) and evidence for burning. The resulting spatial database allows us to explore questions beyond site layout. For example, the V-shaped wall alignment at the bottom left corner of the map is unusual, not just because it’s separated from the main body of the southern room block, but also because the proportions of rock types used in its construction differ from most other alignments at the site: most walls in the room blocks are built primarily of conglomerate, while this corner used primarily basalt and other volcanic rock. This may suggest that the alignment is associated with the earlier Classic Mimbres occupation of the site.
The confidence assessments helped us plan our 2011 excavations; given our limited time and labor, we found it best to place units where the architecture was most clearly visible. In other cases, the wall clearing data shows the risks of relying too heavily on surface evidence: although we recorded evidence of burning at several wall segments on the northern room block, excavation there showed no trace of a fire.
When I finish integrating this year’s maps, I’ll be back with a post about the 2011 updated site map and the mapping techniques we use during excavations. In the meantime, feel free to post questions or observations about the 2010 map in the comments.
Explore the News
-
Join Today
Keep up with the latest discoveries in southwestern archaeology. Join today, and receive Archaeology Southwest Magazine, among other member benefits.