- Home
- >
- Preservation Archaeology Blog
- >
- Draw, Scan, Make, and Model: Complementary Approac...
Lance K. Trask, Scientific Illustrator and Archaeology Southwest Member
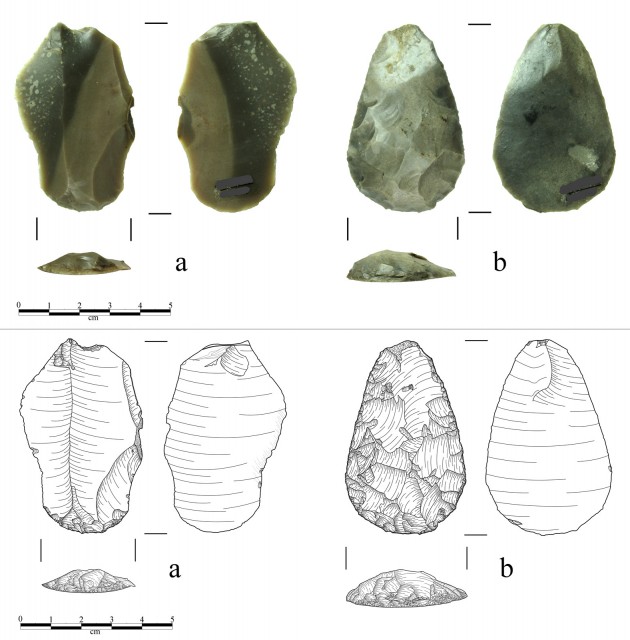
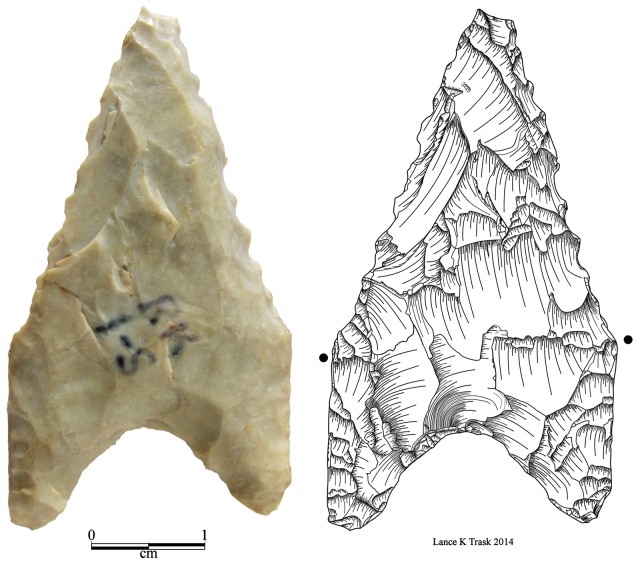
There has been a shift from publishing scientific illustrations of artifacts to publishing photographs. Although there are a number of reasons for this, the primary one is that technical illustrations are a unique art form, and there are increasingly fewer people trained in or practicing that skill set. With the advent of digital cameras, it has become easier to capture and publish a photo of an artifact.
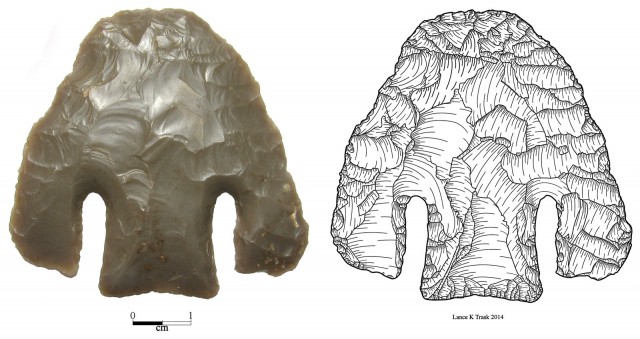
This practice does not compare favorably with technical illustrations, particularly for Paleoindian stone tools, such as Clovis and Folsom projectile points. These types of artifacts are finely flaked, especially along the leading edges. Photographs rarely capture the necessary detail, yet a technical illustration can show every strike of the toolmaker. Although there have not been any studies that I know of, having illustrated hundreds of these points in my lifetime, I believe that it is possible to differentiate between specific knappers. A photograph of a Clovis point may be just another picture of a Clovis point; a scientific illustration reveals a unique point.
|
|
|
Jane Sliva, Desert Archaeology, Inc., Stone Tool Expert
I agree with Lance that scientific illustrations are superior to photographs, especially when budgetary constraints mean you’re limited to B/W or halftones (or both; i.e., not full-color), which make published point photos look awful.
At Desert Archaeology, Inc., we have gone to digital scanning almost exclusively—mortuary artifacts must still be illustrated by hand—because it is far more efficient, and in the CRM (cultural resource management) world, time rules everything. I averaged an hour per point back in my drawing days, and I know some artists take more than that, so from a budgetary standpoint it is obviously much more appealing to be able to scan a couple dozen points in about a minute. Drawing IS great if you have the time and money AND somebody who can do it accurately, but it also limits the recordable flaking attributes to those that are larger than the tip of your pen.
The analytical upside to high-resolution scans is that they give you the ability to zoom in equivalent to a 25x microscope—without losing image sharpness—to see details that are far too small to render with a .01 mm pen nib. And you can get much higher resolution if your hard drive can handle it (says the person still limping along with an XP). I do 1200 dpi (dots per inch), because if I try to go higher my system crashes, but the scanner is capable of 25,000 dpi.
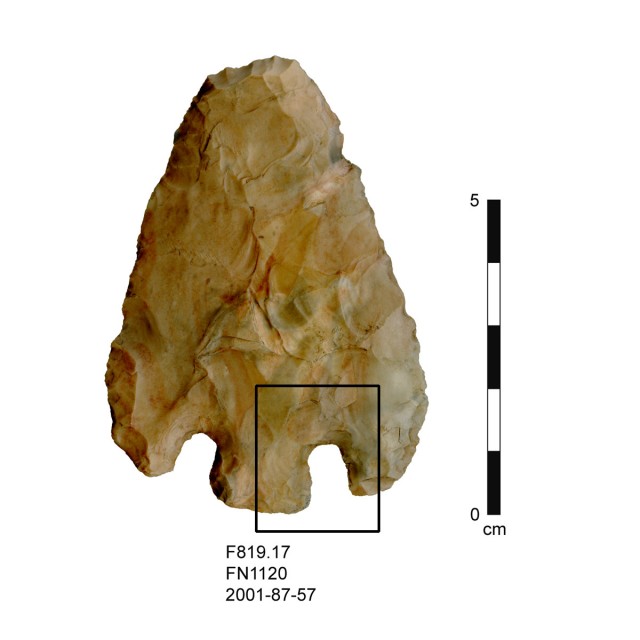
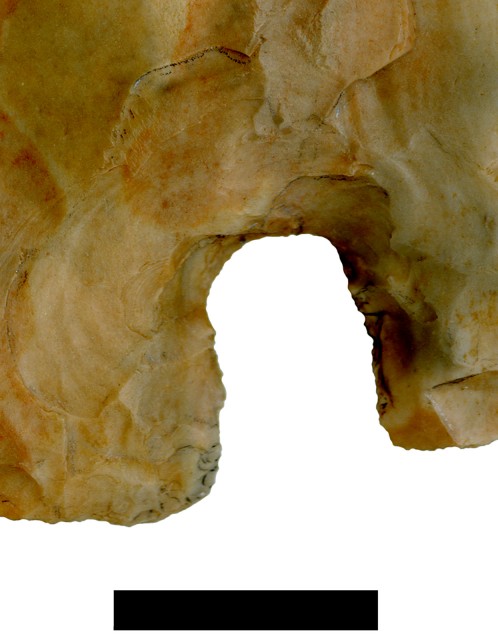
The downside is that a high-quality computer monitor is necessary to take advantage of the enhanced-resolution scans. This is not an issue during the analytical process, as the computers in our lab are adequate for viewing the detailed images, but the digital printers used for most of our hard-copy reports top out at 300 dpi. Greater resolution on paper is possible through offset printing, but that pushes production costs to a level that is untenable for most CRM projects. The solution is to make high-resolution images available electronically, either hosted on a website or included on a CD with the physical volume.
As cool and useful as the zoomed-in digital images are, they will never be as artistically satisfying as a nice pen-and-ink illustration. Then again, I type all my drafts in an antique Remington typewriter font, so my tastes admittedly run to the anachronistic.
Allen Denoyer, Ancient Technologies Expert and Accomplished Flintknapper
I am also a scientific illustrator and an analyst. An additional way I gain an understanding of flaked stone artifacts is by making them. Today, practitioners call this “flintknapping”—the process of removing (by hitting or pushing) flakes until you have your desired tool. Flakes are created by waves of energy passing through material, creating tiny fractures that break away from a larger piece of stone. By understanding the process, flintknappers learn to control flake size and shape.
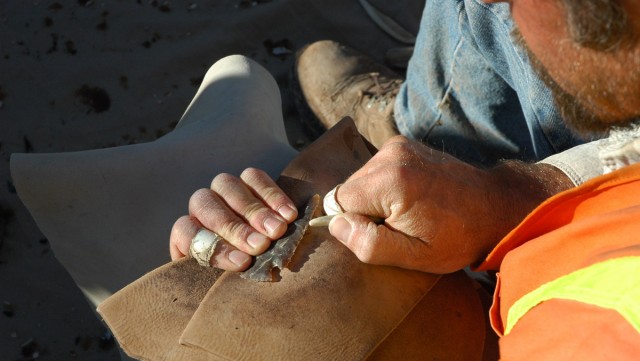
My goal is to make projectile points (dart points, arrow points) as accurately as possible using ancient techniques. In order to do this, I have to look at many archaeological points, particularly the flake scar remnants on their surfaces. The flake scars are a map of the flaking process. Good illustrations and scans are very important, because they show these scars clearly.
By understanding how these scars were created, one can read the surface of a projectile point like a map. Observing bifaces (stone tools that have been flaked on both sides) from earlier in the flaking process (meaning, they were left in that stage of manufacture and not worked further into points or other tools, for whatever reason) shows the maker’s strategy from the start to the finished product—as Lance notes above. In this way, points of different finished shapes may show different stages along a continuum of the subtractive manufacturing process. It is also possible to understand change through time in point styles through observable details of the manufacturing processes.
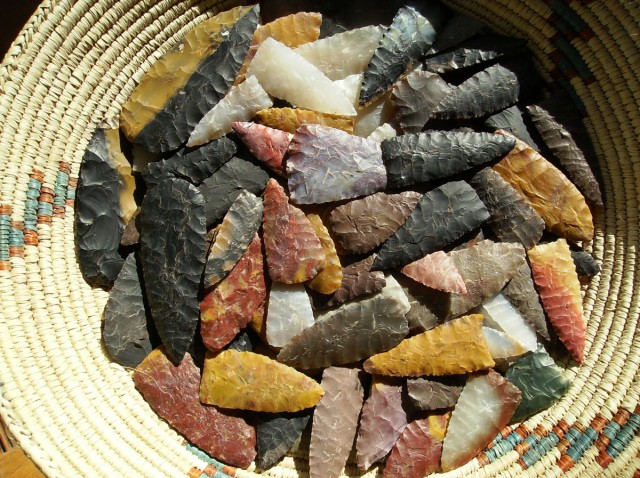
Doug Gann, Preservation Archaeologist and Digital Media Specialist
So where does this all lead? By now it is fairly obvious that three-dimensional recording of ancient objects is creating a new wave of interest in the ways that ancient and historic objects can be digitized for scientific research and public interpretation. The Smithsonian Institution and British Museum have recently placed large collections of important objects online, where they are available for home 3D printing. Behind the scenes, there has been an explosion of new hardware and software technologies for digitizing, modeling, and rendering ancient objects.
At Archaeology Southwest, we have thus far focused on rapid photographic digitization techniques to convert physical objects into digital representations for use in animation and game engines. As an example, here is one of Allen’s Clovis point replicas.
Notice how the model reflects Lance’s concern about the lack of detail that photographic illustrations can provide. On the digital modeling side, this is mostly due to the current state of Internet bandwidth. To share an interactive micron-scale laser scan of the Clovis point that would highlight every flake scar, we would need to serve about 500 megabytes of data, which would quickly overload most viewers’ computers. To create a model that we can quickly share, we have to reduce the level of detail of the geometric mesh through a process called decimation. In this case, the total size of the model is only around 1.3 megabytes, a file size easily shared online, and a simple fast download for 3D printing.
To get around this problem of bandwidth vs. level of detail, there are a number of new methods for sharing graphical representations of three-dimensional objects that we will be exploring here on the Preservation Archaeology blog over the next year. Buckle your virtual seatbelts—this new world presents a number of unique opportunities and challenges for preservation, research, and interpretation in archaeology.
Atlatl
by Doug Gann
on Sketchfab
One of the more interesting things we can do with three-dimensional modeling is reassemble objects with parts that would not survive in the archaeological record. Here, a projectile point can be seen as part of a complete hunting system.
Although Archaeology Southwest can’t quickly teach you how to illustrate, analyze, or digitally model stone tools, we CAN teach you how to MAKE them! Click here to register for one of Allen’s upcoming beginning flintknapping workshops.
4 thoughts on “Draw, Scan, Make, and Model: Complementary Approaches to Understanding Stone Tools”
Comments are closed.
Explore the News
Related to This
-
Project Hands-On Archaeology
I’ve found Reflectance Transformation Imaging (RTI) to be a useful tool for imaging flake scars on stone tools. I’ve put a couple of sample pics online at the CHI RTI forum:
http://forums.culturalheritageimaging.org/index.php?/topic/282-new-paper-on-using-rti-for-virtual-whitening/
(scroll down to the third comment for the pics)
I’m also working on some ideas on how you could use RTI data directly to create an “automated” line drawing.
Illustrating reports and drawing artifacts was how I stayed employed for years between projects as a dirt archaeologist. I also think it improved my eye for artifacts. I recommend Alan’s class for anyone interested in archaeology.
As Jane noted, one can only draw as fine as the pen tip used. My solution to that was to use software on my computer to draw as fine and detailed line as I like. I’m still doing the drawing by hand, so to speak, and if I make a mistake I have the program reverse my steps back before the error. It is much faster, more accurate, and now I can show every strike all the way down to the sharpening of the edges.
Jane also pointed out how it is not cost effective to do these types of illustrations In-house. Which is one reason I contract to do scientific illustrations. I charge by the point and not by the hour. Like most artists; if we charged by the hour no one could afford us.
Clearly we are on a cusp of the digital age in archaeology. And Allen has given us a good introduction into what we will see in the near future. With the limiting factor being paper reports I still feel scientific Illustrations are the best way to best show general and specific attributes of artifacts. If or when we go to electronic reports I believe the detail in scientific illustrations will still be able to hold its own in comparison with digital photography.