- Home
- >
- Preservation Archaeology Blog
- >
- The Data Underlying Preservation Archaeology: Pres...

(February 24, 2021)—It has been almost a year since I was last in the Archaeology Southwest office regularly…but that doesn’t mean I haven’t been busy. And I’m referring to actual work, not just re-learning to play the guitar and putting a lot of miles on my bicycle. Since our launch of cyberSW in June 2020, I have worked with my main partner on this project—Andre Takagi—developing both the underlying database and the web-based science gateway (https://cybersw.org). I thought I’d give you all a quick update on the project with a few hints about where things are headed. I am on the calendar for the April 6, 2021, Archaeology Café, and I plan to do a deeper dive into the future of cyberSW in that presentation.
CyberSW: What is it?
If you haven’t had a chance to visit cyberSW lately, it’s worth clicking that link. If you’re new to the site, please consider registering (it’s painless).
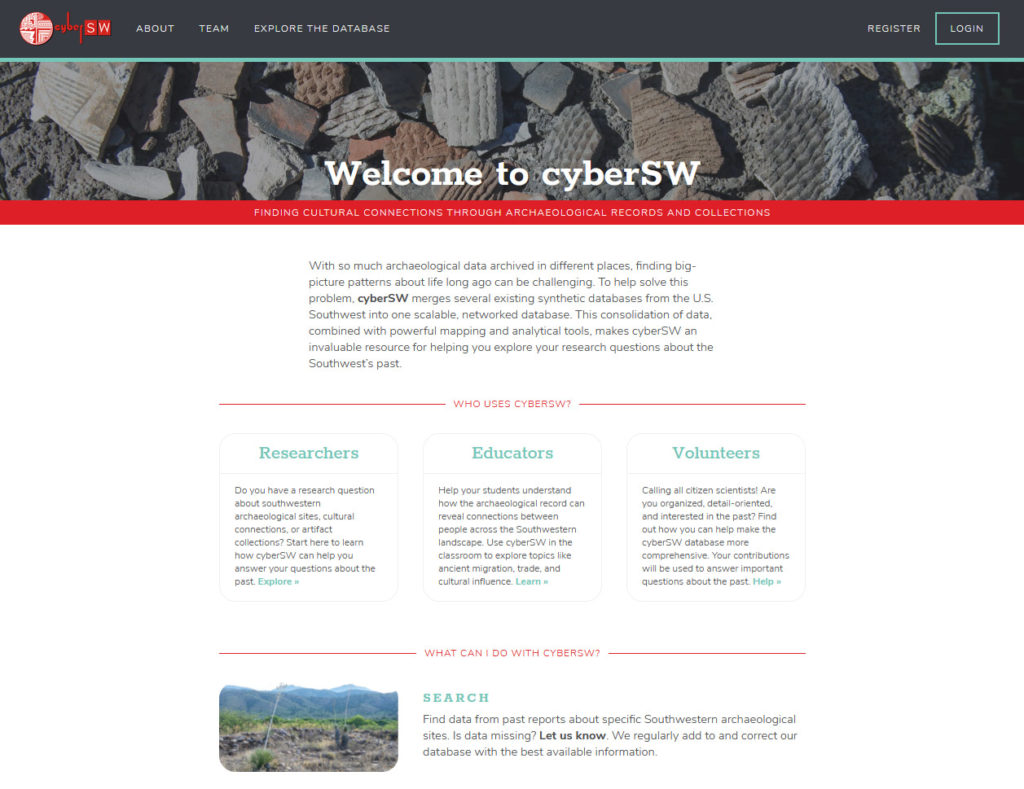
If you are new to this project or need a reminder: cyberSW (supported by NSF Award # 1738062), is a web-based science gateway built to facilitate research on the regional- and landscape-scale archaeology in the Southwest United States and Northwest Mexico. CyberSW is maintained by Archaeology Southwest, extending the broader ethic of Preservation Archaeology to the data generated during archaeological field and lab work—much of it from cultural resource management projects—to advance science, education, and partnership with Indigenous communities. In addition to newer field projects, cyberSW aggregates data from three legacy databases: Coalescent Communities, Southwest Social Networks, and Chaco Social Networks.

The data—which are focused on sites, ceramics, obsidian, and public architecture—are collected from a wide variety of sources, and adapted to fit the data model of cyberSW so that researchers can query the data and conduct analyses without having to build their own ontologies. In other words, cyberSW is a massive research database where we have done the prep work so we can ask (and answer) big questions, but our users do not have to do the tedious work of stitching different datasets together themselves.
Topics such as ancient demography, migration, and social networks are particularly well suited to this large yet cohesive research database. We are already seeing some very interesting new research papers that have made us of cyberSW in top-tier journals. Two examples come immediately to mind:
- Nicolas Gauthier (2021). Hydroclimate variability influenced social interaction in the prehistoric American Southwest. In Frontiers in Earth Science.
- Hegmon, M., Russell, W., Baller, K., Peeples, M., & Striker, S. (2021). The Social Significance of Mimbres Painted Pottery in the U.S. Southwest. American Antiquity, 86(1), 23–42. https://doi.org/10.1017/aaq.2020.63 (also see this blog post).
A few notable updates
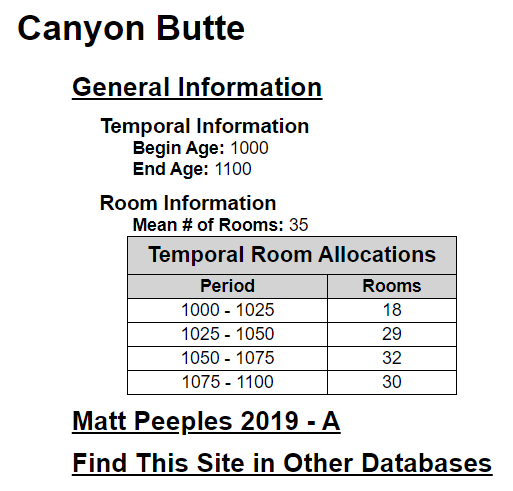
One of the cool new features recently added to the web app is a tool that estimates the number of inhabited rooms at a site based on 25-year time intervals. (The underlying idea being that even if a large site has 200 recorded rooms, people were not living in all of them at the same time.) For sites with large decorated ceramic assemblages, this estimate is derived from a modification of Scott Ortman’s method of Uniform Probability Density Analysis (UPDA). But for sites lacking ceramic data, we rely on a logistic growth curve that dates back to a paper published by Archaeology Southwest researchers in 2004.

We’re also about to add a tool kit for using ceramic and obsidian assemblages to build social networks—and documenting how those networks evolved through time. This kind of research has been important to Archaeology Southwest and our many collaborators for many years now, but once this tool is live on the app, the whole process—from calculating similarity and network statistics like centrality, to displaying publication-ready figures—will be streamlined and relatively easy.
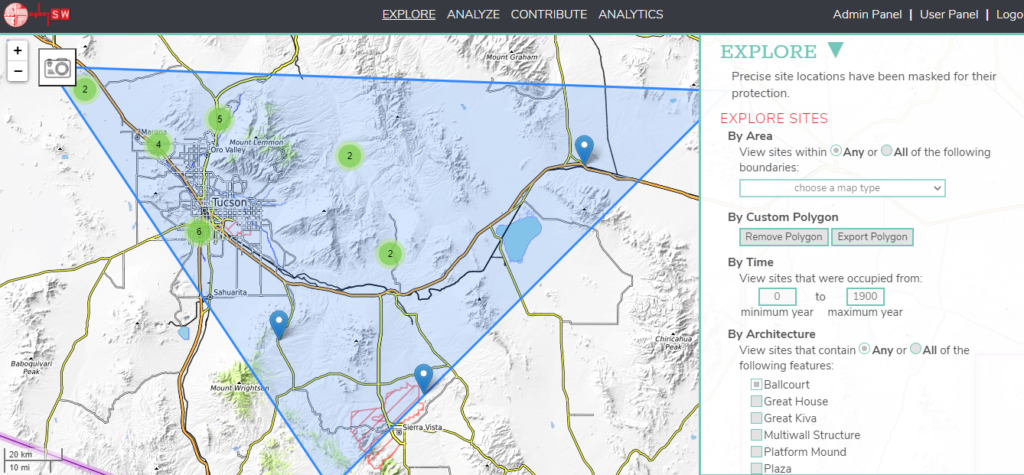
If you dive into the cyberSW web app, the Explore tab has some great new options for identifying sites that might have data you are interested in. For example, you can now search by sites with public architecture. As in, if you wanted to focus your analysis on sites with Great Houses or Ballcourts (or both), you can check that box and return a map (and list) of those sites. Finding sites by material types (for example, specific ceramic types or wares, or obsidian sources) has also been improved significantly since our June 2020 launch.

Challenges and living up to the potential of cyberSW
By making all this archaeological data available online, we created some challenges for ourselves regarding the protection of sensitive information. What to include?
For example, as a general rule we cannot post accurate site locations on the chance that someone with, shall we say, bad intentions would use our app to easily find and damage sites. So, while the artifact data from archaeological sites are available to registered users, sensitive information such as site locations remains masked for all users. This means all our maps of site locations (and any coordinates shown) display somewhat fudged points for site locations. For almost all users, who are asking regional-scale research questions, if a site is shown roughly a mile from where it is actually located (for example), it matters little to their results—and the site location remains protected.
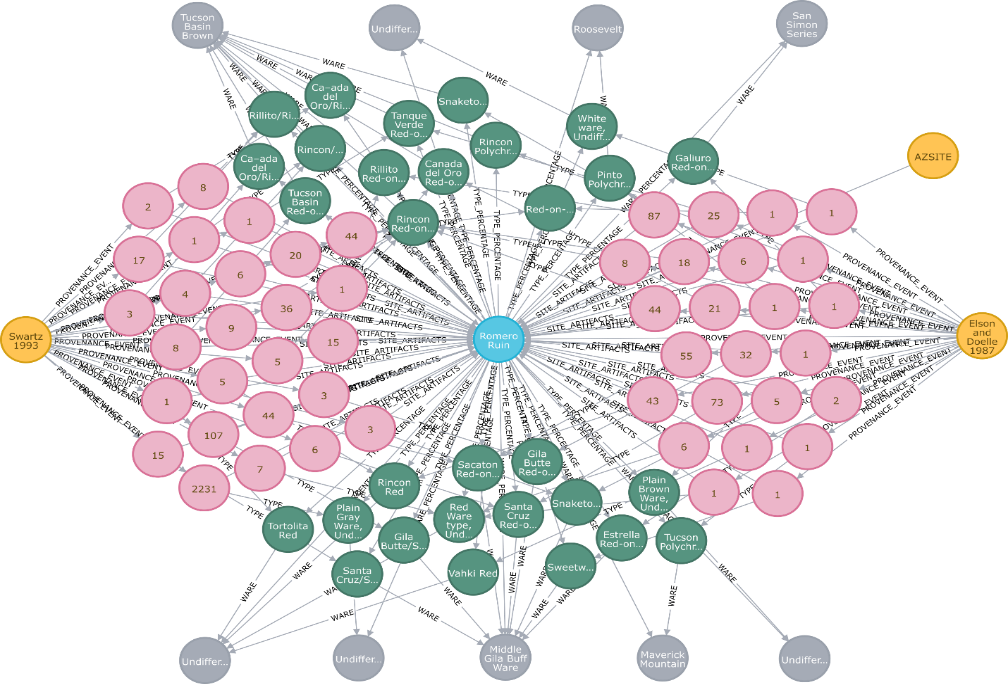
As someone who started his career doing a lot of archaeological fieldwork all around the Southwest, I’m hesitant to admit that now I mostly spend my days on database housekeeping and writing scripts/code to shuffle data around. And perhaps I am even more cautious in arguing that one of the coolest things about the cyberSW project (really!) is something most of you will never see: It is built on a new graph database platform called Neo4j. Although archaeological datasets—even large datasets like cyberSW, which includes over 20 thousand sites and 13.5 million ceramics—barely register as “Big Data” in the way that term is used by data scientists, our data model is incredibly complex. We sometimes say “typologically and taxonomically complex,” but that’s a mouthful. Importantly, the Neo4j graph database platform is remarkably flexible, and a very elegant way to manage datasets from across the region and from a variety of sources.

Over the next few years we are planning to extend the current database structure, which is mostly focused on site- or settlement-level aggregated data, to include data at a much finer resolution. Imagine household-level data from across the Southwest, analogous in some ways to how the US Census is structured. That should allow for more refined analyses (for example, better chronological control) while still chasing the regional research questions that this unique database is best suited for addressing. Plus, there is a ton of potential in collaborating with social scientists beyond our core user base of archaeologists, such as economists and geographers, who are long used to working with household-level data.
This whole effort will be incredibly challenging, but the potential of the effort—and keeping these data alive for all our users—makes me think it’s totally worth it.